
The details of the Stanton system's Aaron Halo asteroid belt have been a mystery for a long time, but during the last couple of years more information about its features have steadily been revealed by several explorers who have pushed beyond to learn and bring back new data about it.
My goal for this survey expedition was to comprehensively determine the characteristics of the asteroid belt from a general scientific perspective - including to verify if the asteroid belt structure is the same across different game servers, determine if its density differs around the circumference of the star, and most importantly to measure and gather details on its size, shape and density.
The main outcome of the survey can be summarized in this chart, which exhibit the precise width and asteroid density of the 10 bands.
Read on to learn about the expedition details and findings.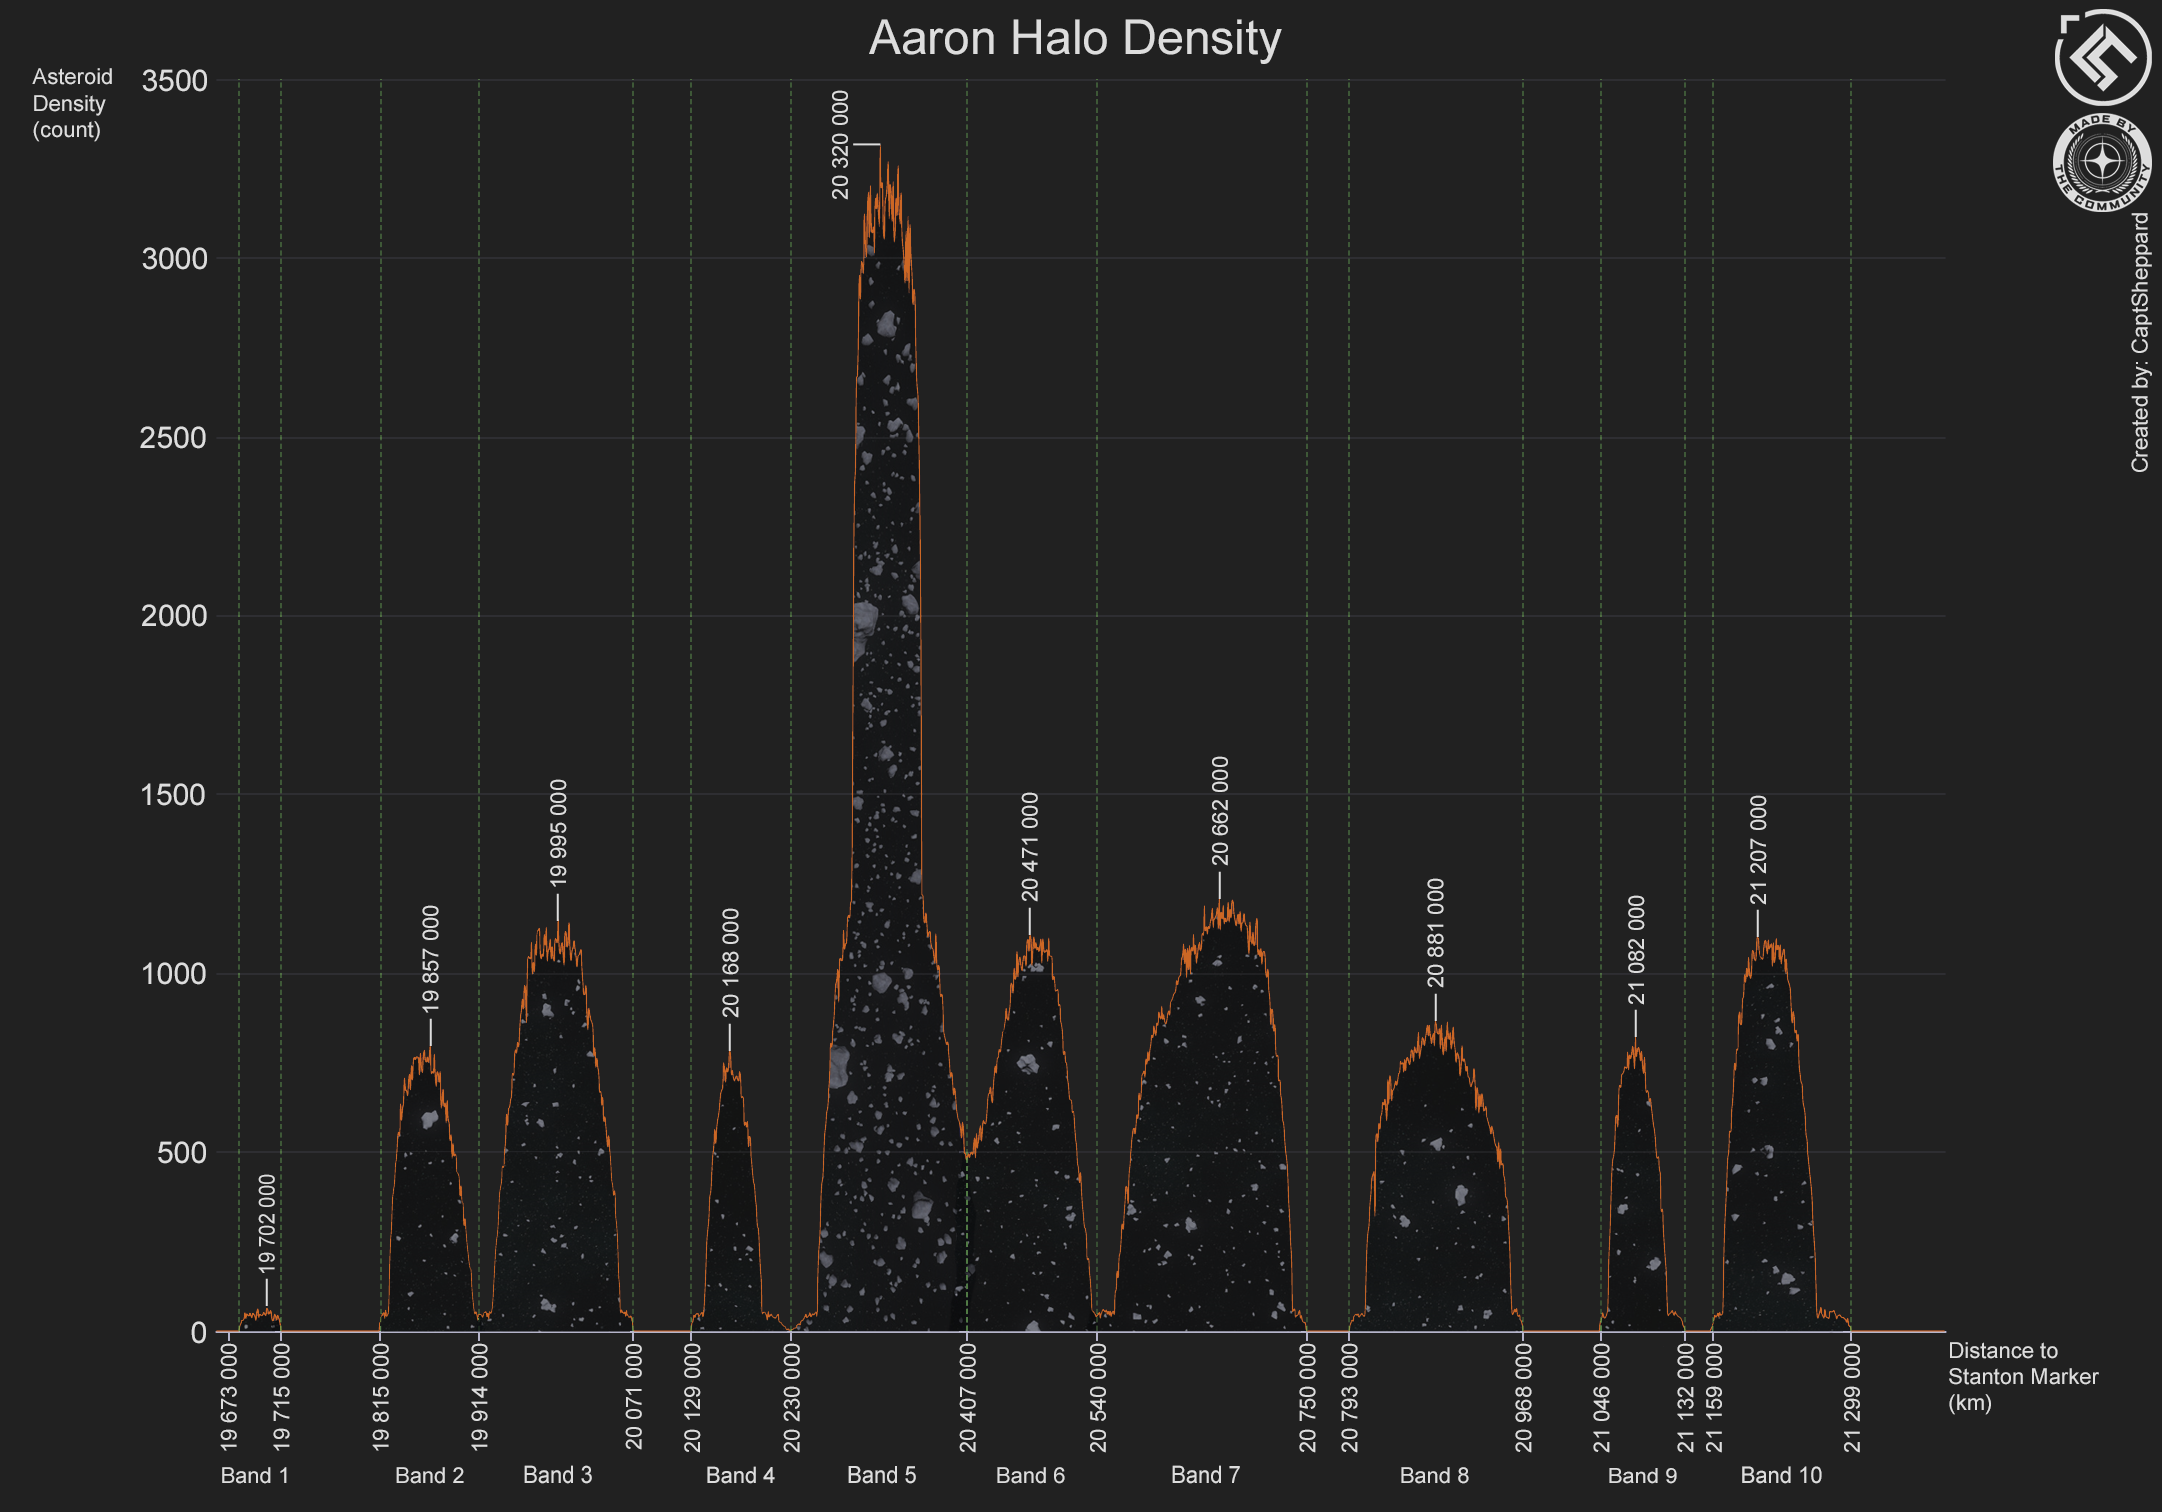
Survey Period: January - March, 2952
Game Version: alpha 3.16.1-LIVE
Article Updated: 2952-03-23
Through earlier expeditions carried out by several explorers, we knew the broad inner and outer borders of the belt. We also had information about the existence of eight separate bands within the belt, and a broad analysis of the density had also been conducted.
Personally, I have for the past year and a half had regular expeditions to study the Aaron Halo asteroid belt, mapping more of its features for each visit. The results of these expeditions have up till now been focused on my Refinery to Aaron Halo Travel Routes with individual charts, mostly used by miners. Now it was time for the next expedition, that would take it to the next level and take a more comprehensive look at the Halo's features.
This survey expedition was a substantial project. From the start of planning to survey completion the whole process has taken around two months, and to accomplish it there was a need to divide into several phases. The Execution chapter covers the various phases and how they were carried out, while the Results chapter presents the survey data and analysis results.
Table of contents:
Execution
Preparations (Phase 1)
Cross Server Consistency Survey (Phase 2)
Trial Density Surveys (Phase 3)
Main Density Survey (Phase 4)
Height Survey (Phase 5)
Results
Asteroid Belt Width
Asteroid Belt Height
Asteroid Density In Bands
Mineable Asteroids Considerations
Conclusion
Acknowledgements
Execution
Preparations (Phase 1)
Initial planning:
Star Citizen's coordinate structure for a star system is divided into a three-dimensional xyz-grid. Using this grid, the asteroid belt width was to be measured along the x- and y-axis and its height to be measured along the z-axis. The width of individual bands, and positions of individual images taken for density analysis, was to be measured by reading their distance to the xyz-grid centerpoint. This centerpoint can be seen in the ingame starmap as the Stanton quantum marker. The height of the bands was to be measured by retreiving location coordinates at the starting point, along a route at the planetary level (along the x/y-axis), and again at the high/low point (along the z-axis) by using the "/showlocation" console command. The height was then calculated from this data.
Note: The asteroid belt, as all other objects in the system, is centered around the Stanton quantum marker, not the Stanton star. The star is elevated and offset from the centered marker, and does not have a quantum marker.
Fun-Fact: Since the planets rotational axis are parallel to the z-axis (and not tilted), the offset position of the star is the reason for different lighting conditions on the north and south poles.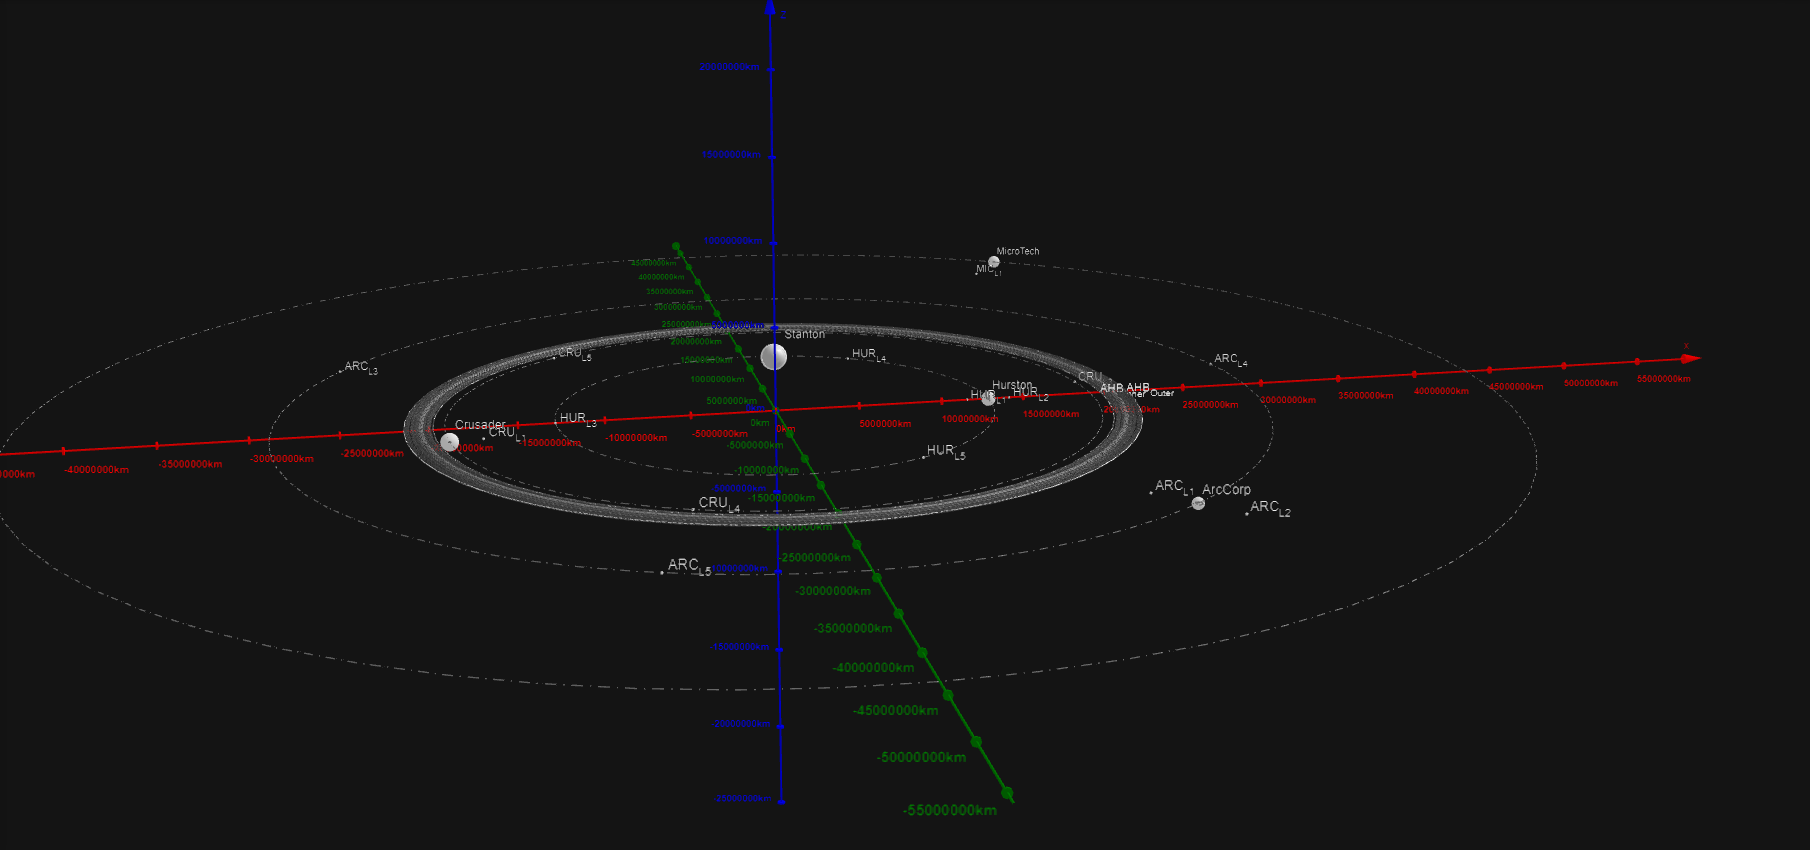
(red = x-axis | green = y-axis | blue = z-axis)
The initial preparations included drafting a time schedule for the survey, administrative planning, defining image naming standards, ingame testing to determine the best ship and quantum drive to use, decide the best procedure for analysing density in the images, and finally laying a detailed plan for the various phases that was needed.
Density measurements was to be done by flying along predetermined routes directly towards the Stanton quantum marker to ensure a 90-degree angle on the belt. By quantum jumping in predetermined intervals throughout the belt and taking screenshots for each stop using a predetermined camera view, the set of images gathered was then to be analysed to count the amount of asteroids they contain. This would provide a statistical foundation for the analysis, but the data would be limited to what was viewed in each specific image and would not represent the total number of asteroids surrounding you at that specific location. This was decided to be the best practial approach to collect information about the density, as analysing a full 360-degree sphere view of each data point would be too much of an effort.
Image processing:
Before any other tasks were initiated, it was necessary to determine an effective way to perform the analysis process for counting asteroids in what would become more than two thousand gathered images. There was no point in starting with the other tasks until a solid method for this was in place. Due to the amount of data to analyse and aspiration to minimize human error, it was decided to make counting a fully automated process. With the help of Bo-Fone from Curvature Group, a custom Image Processing AI solution was trained and configured for the job, and an ingame camera angle preset to be used for all gathered images was established. Images were to be taken in the opposite direction of the star, in order to have minimal interference and maximum lighting of the asteroids. The rest of the project could then get under way. 
(Example from the image analysis process)
Ship and Quantum Drive Selection:
The next step was to ascertain which ship to use for the survey. To have consistency with camera views, location coordinate registration, etc, it was decided to use the same ship for all density surveys. A small ship was preferred in order to easily navigate inside dense asteroid fields, and the ship was also required to have a bed for log-outs between survey sessions. It was decided to use the Origin 135C, as it is a small and agile ship with bed-log capability. Research also went into which would be the best suitable quantum drive for the many quantum jumps that were needed. Based on experience from previous expeditions, the Flood quantum drive was selected because it has the slowest stage 1 acceleration speed, which was suitable for having good control during repetitive short quantum jumps of 5000 km intervals.
Later, when doing a preliminary test for the main density survey, it was discovered that the Flood quantum drive did not work sufficiently for a quantum jump interval of 1000 km. At the 1000 km distance the Flood quantum drive was in the middle of its transition into stage 1 acceleration, making it impossible to abort quantum travel at that point. So before the main survey could start, a new round of testing was needed to try alternative quantum drives and find one that could handle the required behaviour. After testing the VK-00, Beacon, Goliath, LightFire, Expedition, Colossus, Siren and Vulcan quantum drives it was determined that the LightFire was well suited for the job. Its initial acceleration phase is adequately slow so that it doesn't reach the transition into stage 1 during the first 1000 kms, and the quantum abort/exit procedure proved to be very stable and reliable.
Finally, in the height survey phase the need for bed-log and imaging consistency was replaced with the need for maximum propulsion speed. To achieve this, the Origin 135C was replaced with a stock outfitted Drake Herald, which has the fastest speed of any ship ingame (1360 m/s).
The survey also provided some interesting data about the quantum drives. All ship components have a wear-and-tear system, where they will deteriorate and require maintenance as they are used. During the trial surveys, the Flood civilian drive was able to perform about 100 quantum jumps before I started noticing wear-and-tear, after which the drives spooling and calibration procedure took increasingly longer time and the jump procedure became laggy and sometimes failed to initiate. About 50 jumps later it was practically unusable and in dire need of repairs. The LightFire competition drive was more sturdy, achieving about 200 quantum jumps before showing the same behaviour.
For ship and component maintenance I flew back to the base of operations station for refuel and repairs, at which point I also took the opportunity to stock up on sustenance supplies. I then flew the same route back to the exact point I had left. A total of eight maintenance trips was needed for the large main density survey,
Cross-Server Consistency Survey (Phase 2)
Before any density measures began it was necessary to determine if the asteroid belt was consistent across game serves or if it had variations. If variations were found there would be no point in measuring density, as players on different servers could experience varying asteroid density at the same location. A series of images was taken at the exact same location across multiple servers in different regions, using bed-log to switch between them. This revealed that the asteroid structure and positioning were exactly the same on all servers, which meant that the density count would give the same result no matter which server was measured. 
(Density images from three different servers)
Trial Density Surveys (Phase 3)
To ascertain whether the asteroid belts have the same structure and density curve all around the circumference of the star, or if there are variations, it was decided to first conduct two trial surveys runs along two different routes, with image collection done in 5000 km intervals. This produced 350 images/data points for each route, which was enough resolution to have a clear view on how the density curve would appear in a chart. If the curves of the two routes showed to have variations it would point to a randomly generated band structure, and that a density survey would be needed for every route we wanted data for - an unfeasibly large endeavour. If the two routes showed to be identical, one detailed survey pass would give useful data for the entire circumference of the belt.
- Survey planning start: 2952-01-25
- Survey start: 2952-01-28
- Survey complete: 2952-01-29
- Analysis start: 2952-02-06
- Analysis complete: 2952-02-07
- Survey Route: Stanton QT Marker <-> ARC-L1
- Base of operations: ARC-L1 R&R, Wide Forest Station
- Ship: Origin 135c
- Quantum Drive: Flood
- Number of images: 350
- Measure interval: 5 000 km
- Distance measured: 1 745 000 km
- Innermost survey point (STN distance): 19 650 000 km
- Outermost survey point (STN distance): 21 395 000 km
- Survey time (active ingame): 9hrs 30min
- Survey planning start: 2952-01-30
- Survey start: 2952-01-31
- Survey complete: 2952-01-31
- Analysis start: 2952-02-06
- Analysis complete: 2952-02-07
- Survey Route: Stanton QT Marker <-> ARC-L3
- Base of operations: ARC-L3 R&R, Thundering Express Station
- Ship: Origin 135c
- Quantum Drive: Flood
- Number of images: 350
- Measure interval: 5 000 km
- Distance measured: 1 745 000 km
- Innermost survey point (STN distance): 19 650 000 km
- Outermost survey point (STN distance): 21 395 000 km
- Survey time (active ingame): 7hrs 20min
Trial Survey Density Curve:
The results proved that the density structure was the same for both routes. This made it possible to carry out one main density survey that would reveal a detailed density pattern for the entire circumference of the star.
Another goal for the trial surveys was to perfectionize the survey procedure, to weed out errors, and generally recognize game server behaviour that could affect the results. As you can see in the chart above there are some low mis-readings that was due to not waiting long enough for all asteroids to spawn in, which could sometimes take up to 45-60 seconds. And sometimes a very short quantum jump to fine-adjust the position would, for a short period, cause asteroids for both the current and previous positions to show, giving a too high count in some images. This was valuable learning in order to avoid these mistakes during the main survey - patience was key for waiting long enough for asteroids to spawn both in and out.
Main Density Survey (Phase 4)
The trial survey results paved the way for the main density survey, that would reveal the true form and density of the belt with very detailed resolution. The main survey was to be run along a third route, with image collection done in 1000 km intervals. To maximize precision, an interval offset of no more than +/- 200 km for every 1000 km was defined, as this was the most precise quantum exit variation it was practically possible to get out of the quantum drive. The cleanest possible skybox background was needed to provide minimal interference in the image analysis procedure. After several reconnaissance trips around the system, the route between the Stanton QT marker and MIC-L1 was determined to have the cleanest skybox. 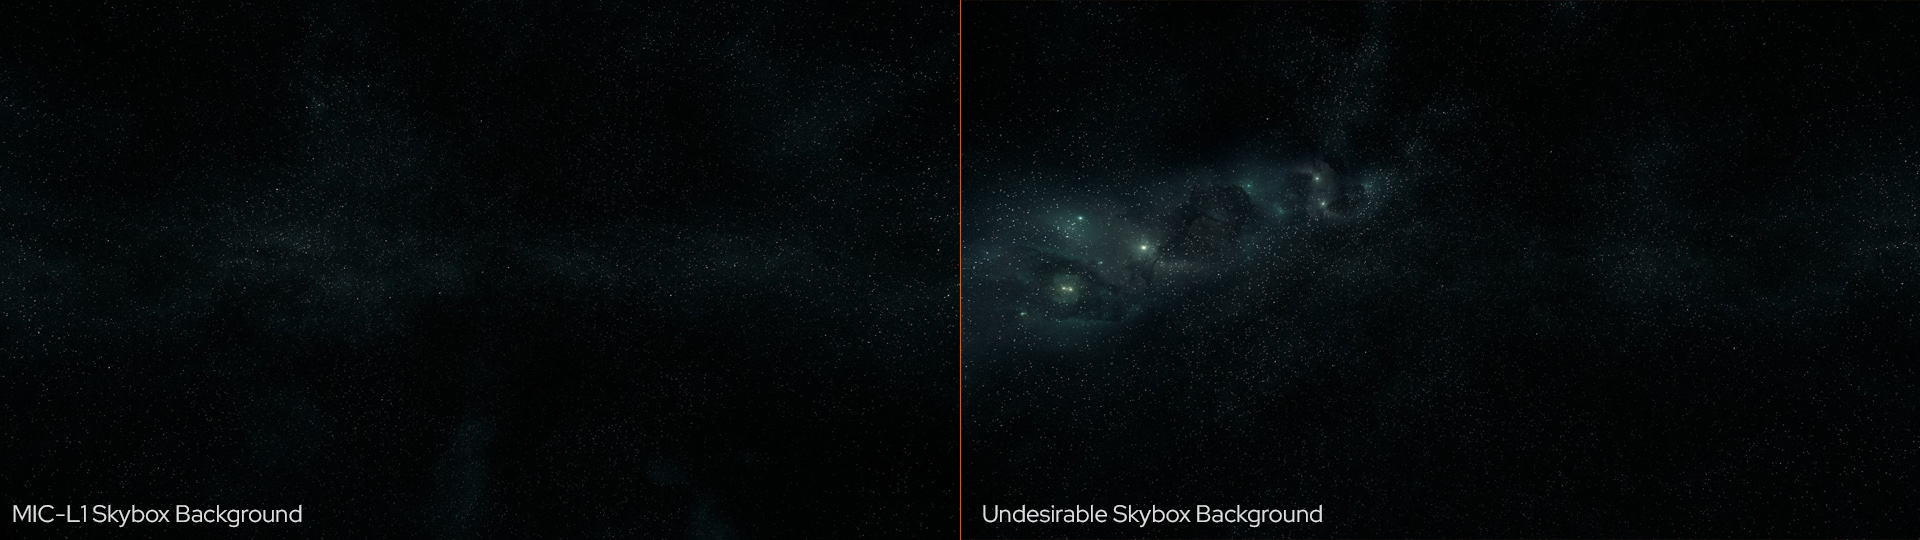
(Example of skybox variations)
Spanning 11 sessions over 7 days, this phase gathered a total of 1746 images/data points. Except for two 30k server crashes and a couple of slow servers causing quantum over-jumps or asteroids not spawning, morale was high and the entire survey went very smooth. 
- Survey planning start: 2952-02-08
- Survey start: 2952-02-10
- Survey complete:2952-02-16
- Analysis start: 2952-02-19
- Analysis complete: 2952-02-24
- Survey Route: Stanton QT Marker <-> MIC-L1
- Base of operations: MC-L1 R&R, Shallow Frontier Station
- Ship: Origin 135c
- Quantum Drive: LightFire
- Number of images: 1746
- Measure interval: 1 000 km
- Measure interval max offset: +- 200 km
- Distance measured: 1 745 000 km
- Innermost survey point (STN distance): 19 650 000 km
- Outermost survey point (STN distance): 21 395 000 km
- Survey Sessions: 11
- Survey time (active ingame): 38hrs 44min
Height Survey (Phase 5)
The goal of this final survey phase was to determine the height of each band. Measurement in this phase was not as detailed as the rest of the survey, and the asteroid density have not been measured along the z-axis, as the priority has been to gather this data along the routes people can easily travel on the planetary level (x/y-axis). It is however of scientific interest to gather data on the height of each band in order to get an estimation on the total shape and volume of the bands.
During this survey pass the height was measured at the most dense point of each band. This was accomplished by quantum jumping to this point in each band and then travelling parallel to the z-axis until the high point and low point borders of the band was found. Since there are no quantum travel markers available to travel along the z-axis, this survey phase was done by regular propulsion travel.
The precise direction of travel had to be determined, as the ship compass/pitch instruments point towards the Stanton star, and not the Stanton quantum marker, as the center point. As the star is offset from the planetary level, it was necessary to alter pitch by 8/-8 degrees in order to have a travel path parallel to the z-axis. To stay on course, the ship was flown at full speed in decoupled mode, with pitch/yaw movement locked. A sharp focus was required at all times as there was often necessary to fire directional thrusters to temporary adjust course and avoid oncoming asteroids.
- Survey planning start: 2952-02-27
- Survey start: 2952-02-28
- Survey complete: 2952-03-01
- Analysis start: 2952-03-09
- Analysis complete: 2952-03-12
- Survey Route: Stanton QT Marker <-> ARC-L3
- Base of operations: ARC-L3 R&R, Thundering Express Station
- Ship: Origin Drake Herald
- Quantum Drive: LightFire
- Total Kilometers Travelled: 65 087 km
- High-Points measured: 10
- Low-Points measured: 10
- High-Point Compass heading: 0
- High-Point Pitch: -8
- Low-Point Compass heading: 180
- Low-Point Pitch: 8
Results
The Aaron Halo asteroid belt consists of 10 elliptical torus-shaped bands, having their shape and density circumfering undifferentiated all around the Stanton star. The elliptical shape of the bands are quite eminent, as they are a lot wider than their height. For example, the largest band (band 7) is 211 000 km wide but only 10 000 km high. The belt's structure and density is identical across game servers. It's circumference is perfectly circular, with its individual features located at the same distance from the Stanton quantum marker no matter what angle you approach it from.
Asteroid Belt Width
The individual bands widths have been revealed by image analysis from the main density survey. From this we now know down to 1000 km accuracy the position where each band starts and ends, and from this data we also know their individual widths. Except for a more narrow and thin band 1, the width of the bands are fairly homogeneous. As you will later see in the density chart, some of the bands overlap or touch with each other while others are separate bands with large voids between them. 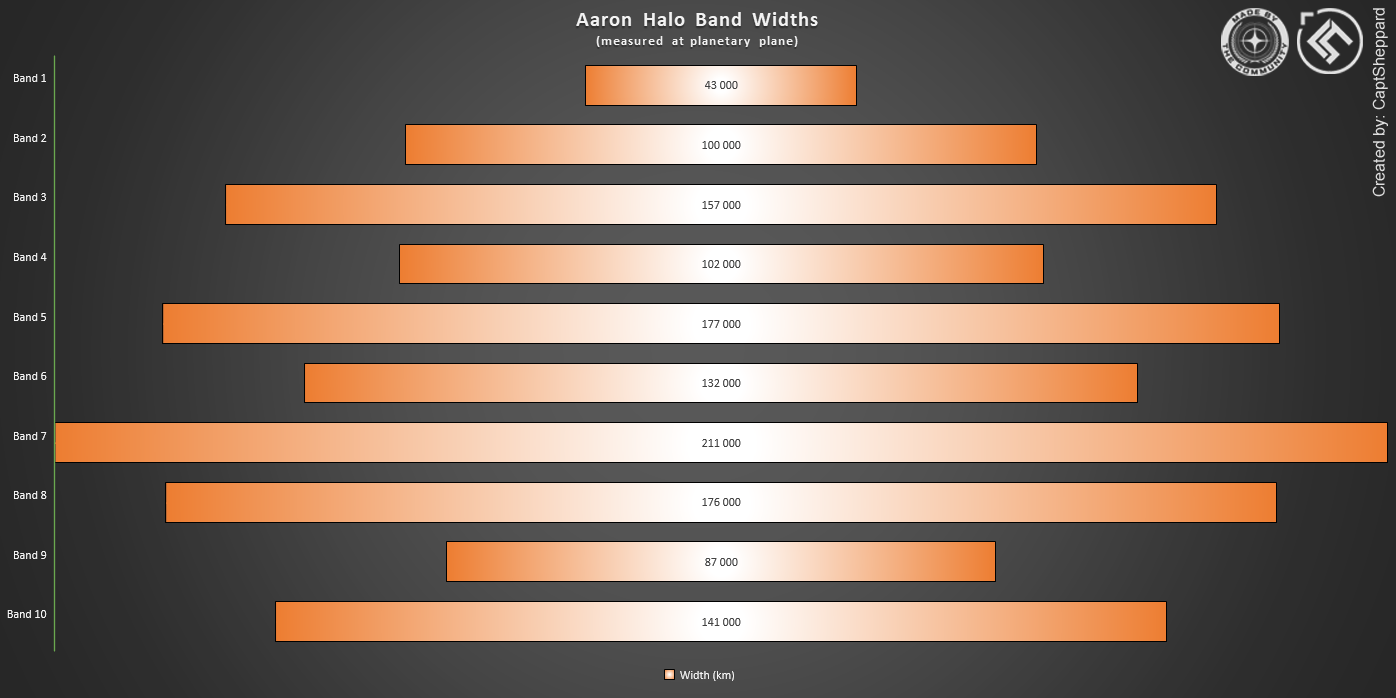
Asteroid Belt Height
Unlike the width patterns, the height of the bands vary more both in distance and density. While flying towards the high/low edges of each band I saw a similar density pattern as was measured along the planetary level, where the inner half is quite dense before it in the outer half will progressively decrease. An interesting observation of density variation is that while bands 1-4, 6 and 8-10 gradually decrease all the way to zero density, bands 5 and 7 have sharp cut borders of still dense asteroids that abruptly ends.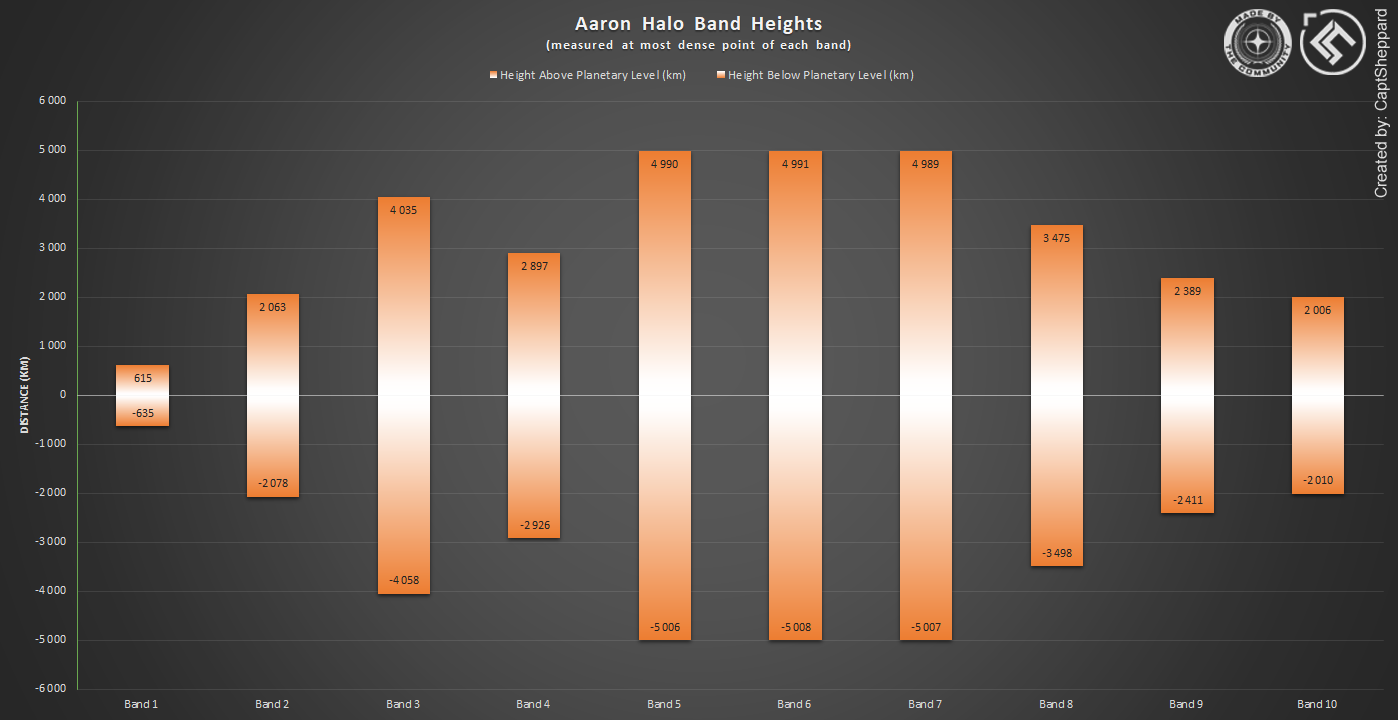
Edge density of bands 1-4, 6 and 8-10:
Edge density of bands 5 and 7:
This chart is a representation of the cross section of the bands, showing the scale of their height vs width.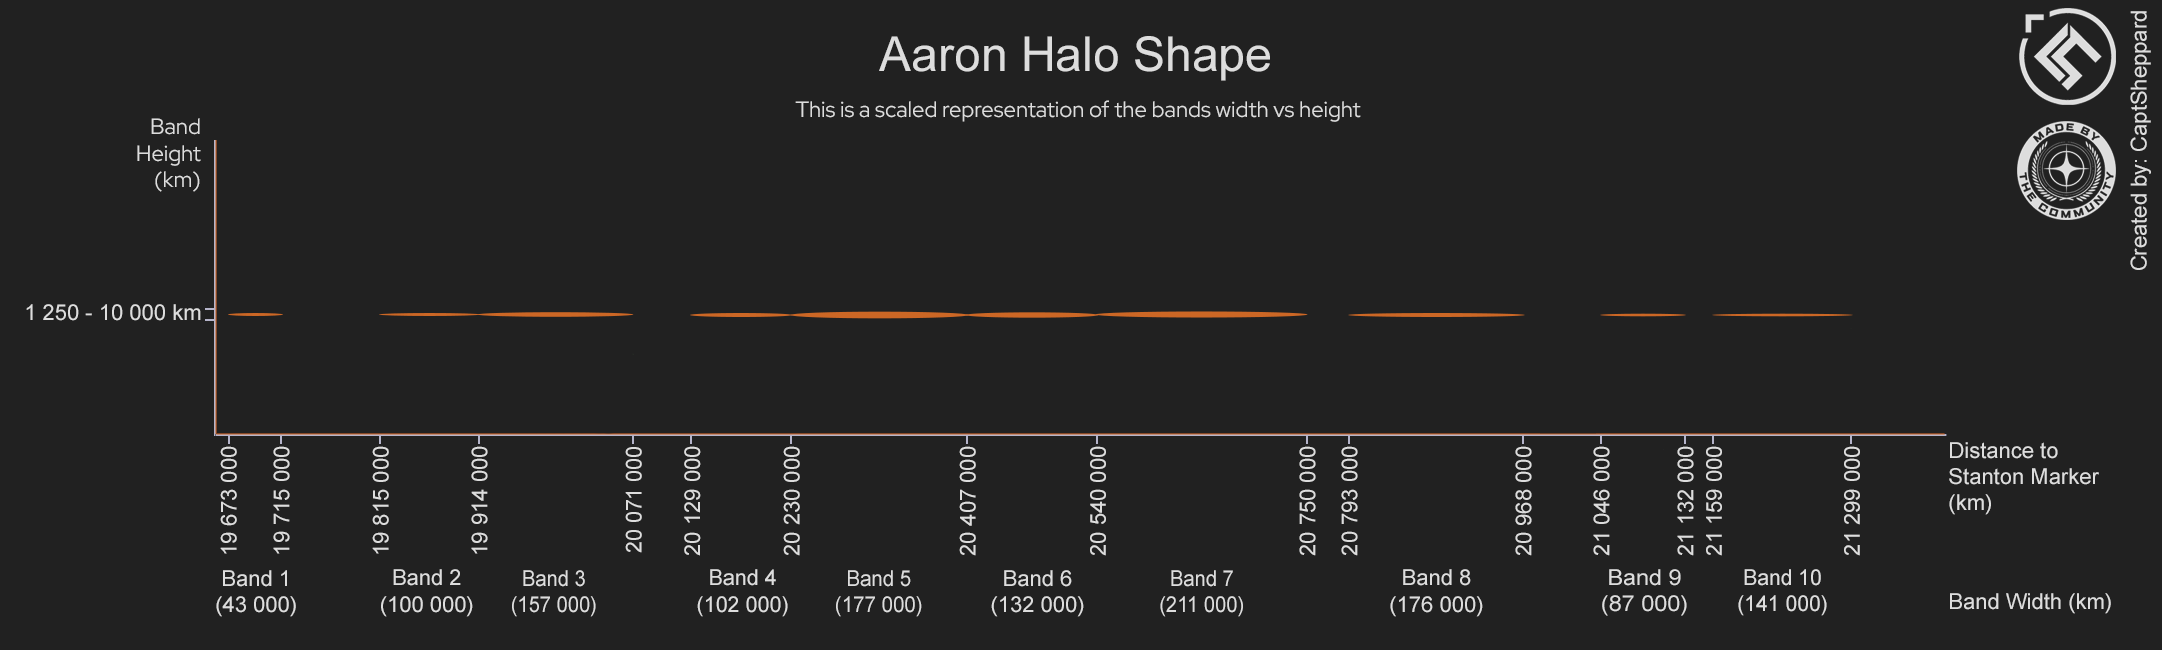
| Band | Width | Total Height | Height Above Planetary Level | Height Below Planetary Level |
| Band 1 | 43 000 km | 1 250 km | 615 km | 635 km |
| Band 2 | 100 000 km | 4 141 km | 2 063 km | 2 078 km |
| Band 3 | 157 000 km | 8 093 km | 4 035 km | 4 058 km |
| Band 4 | 102 000 km | 5 823 km | 2 897 km | 2 926 km |
| Band 5 | 177 000 km | 9 996 km | 4 990 km | 5 006 km |
| Band 6 | 132 000 km | 9 999 km | 4 991 km | 5 008 km |
| Band 7 | 211 000 km | 9 996 km | 4 989 km | 5 007 km |
| Band 8 | 176 000 km | 6 973 km | 3 475 km | 3 498 km |
| Band 9 | 87 000 km | 4 800 km | 2 389 km | 2 411 km |
| Band 10 | 141 000 km | 4 016 km | 2 006 km | 2 010 km |
Asteroid Density In Bands
The asteroid density is fairly consistent throughout the belt, with two exceptions - the tiny band 1 has an exceptionally thin density, and the massive band 5 is over one and a half times as dense as the rest of the bands. What is interesting with band 5 is that it is not only more dense, the asteroids it contains also seem to be larger than those found in the other bands. Check the videos below to see the difference.
Note: The asteroid density count represented in the chart visualize what is gathered from each individual image that has been analyzed, and does not represent the total number of asteroids you are surrounded by at any given location. It is a relative representation of the density you can expect to find.
(Asteroid density as measured along the planetary level, higher = denser)
Note: The asteroid backdrop for each band is an image-segment from the most dense point of that band.
Videos showing variations in density and size of asteroids:
(Density and size example in band 5)
(Density and size example in the other bands)
See this video for a visual fly-through of the belt, showing images from the inner-to-outer edge at 5000 km intervals. Note that the video is based on data from one of the trial surveys, and shows some of the widths having a one thousand km rounding deviation from the final data.
| Band | Inner Border | Outer Border | Center Point | Densest Point |
| Band 1 | 19 673 000 km | 19 715 000 km | 19 694 000 km | 19 702 000 km |
| Band 2 | 19 815 000 km | 19 914 000 km | 19 864 000 km | 19 857 000 km |
| Band 3 | 19 914 000 km | 20 071 000 km | 19 993 000 km | 19 995 000 km |
| Band 4 | 20 129 000 km | 20 230 000 km | 20 180 000 km | 20 168 000 km |
| Band 5 | 20 230 000 km | 20 407 000 km | 20 319 000 km | 20 320 000 km |
| Band 6 | 20 407 000 km | 20 540 000 km | 20 474 000 km | 20 471 000 km |
| Band 7 | 20 540 000 km | 20 750 000 km | 20 645 000 km | 20 662 000 km |
| Band 8 | 20 793 000 km | 20 968 000 km | 20 881 000 km | 20 881 000 km |
| Band 9 | 21 046 000 km | 21 132 000 km | 21 089 000 km | 21 082 000 km |
| Band 10 | 21 159 000 km | 21 299 000 km | 21 229 000 km | 21 207 000 km |
(Distance in km from Stanton quantum marker)
Mineable Asteroids Considerations
Note that this survey focus on the overall measurement of observable asteroids in the asteroid belt. It does not measure the density and probability of mineable asteroids. Measuring the distribution of mineable asteroids will likely prove to be difficult. By what we know so far, the Aaron Halo looks to be defined as one region in the game code, where the spawn probability of mineables within that region is randomly distributed. At any visit to the belt there is a random chance to find an empty area or an are rich with mineables. The region likely has configuration values for how much mineable material of each type there should be and how to group them, but not where to place these groups. Random placement of these groups is likely why you may sometimes only rarely find even single mineable rocks while other times can find groups of up to 16 rocks.
With that said, I have during my surveys observed that there seem to be more mineables present at the more dense areas than at the lesser dense edges. So the spawning of mineable asteroids seem to somehow follow the general asteroid density. Note however that this is only my general feeling based on what I have observed during these surveys, and not a proven fact.
More research in to the conditions and foundations that lies behind the spawning of mineable asteroids are needed, but this is out of scope for this survey.
Conclusion
Exploration is fun! From facing the entire Aaron Halo to hunting for Pico balls, ingame exploration is surely possible in many ways. But since it is not yet a defined gameloop we have to be a bit more creative in our exploration ventures. We have unmarked wrecks and other locations to discover and rare loot to find, people are searching the system for hidden Pico's and other easter-eggs, others again are searching for interesting landmarks like the (now lost, but not forgotten) Sketto Rock. There are people travelling around the entire circumference of microTech by land vehicles, we traverse microTech in search of a cozy riverbed, and we have even travelled to the Stanton star. Also, some impressive triangulation and navigation tools are being created and refined upon by members of the community, to help with this exploration.
In this survey expedition I have explored, studied, and demystified the Aaron Halo as much as I can (for now). There will always be more details to discover out there, but one must set a defined goal and not undertake too much in one go. I find it interesting to see how the gathered data have revealed the characteristics of the various halo bands, their width and height, and how the overall density curve is shaped. Especially interesting is it that band 5 is not only more dense than the rest of the bands, its asteroids are also averagely a lot bigger than what you find in the other bands. A recreational trip to band 5 is highly recommended!
As for how long this data will be relevant, nobody/only CIG knows. The Halo has been stable and unchanged in the game for a long time so I would assume that it remains so, at least until CIG implements the Aaron Halo Gateways. When this happen I am very interested to see how they will reshape the asteroid belt - because based on its current width and height I cannot see a sensible or lore-based reason to use these gateways. Why use an intricate construction of gateways to be transported 1.7 million km through an asteroid belt, when you can place small satellite QT-beacons on top of the belt, only ~5000 km above the planetary level, to fly around it instead?
The data collected in this survey has also been used to update my Refinery to Aaron Halo Travel Routes article with new data. These routes have evolved from a simple guide showing distances to the inner and outer edges of the belt, to later showing distances to the center of the previously assumed eight bands within the belt. The most recent version will now display all ten bands and lead you to the verified most dense point of each band. If you are interested in travelling to the Aaron Halo asteroid belt, check out the article to see the many routes that will bring you right into the dense spots of the belt.
PS: Exploration is curiosity put into action. So go explore, and I'll see you in the verse!
CaptSheppard
Acknowledgements
CaptSheppard (Cornerstone) - Ingame Surveys, Data Analysis, Article/Report
Bo-Fone (Curvature Group) - Image Processing and Analysis
Other contributions:
justMurphy (Murphy Exploration Group) - Provided initial data on the asteroid belt location
Sketto (Aaron Halo Mining Co) - Provided initial data on the existence of separate bands within the asteroid belt
Rockseeker (United Earth Mining Corporation) - Provided the first broad measures of the belts density


